
BLUF: Fueled by a massive bull market and a high savings rate in 2021 our invested assets grew by over $275k. We officially joined the double comma club having over $1M in invested assets.
In a previous article, I covered how we saved $140,000 last year in 2021. Today I’m going to dive into where we stand with our investable assets and how that tracks to our overall FI number.
I’ll cover where the investments are located from an account type perspective (brokerage, 401k, crypto). However, what we’re invested in from an asset allocation perspective will be a topic for another post. In general we’re 75/20/5. 75% stocks, 20% bonds, 5% cash and crypto. Mostly invested in low cost mutual funds.
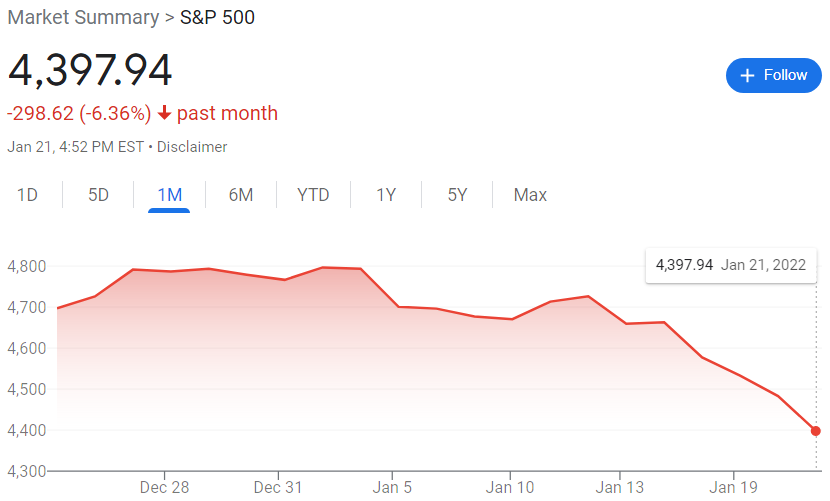
It feels a little odd to be writing about our financial progress last year right after a few weeks negative volatility (week ending Jan 21st, 2022) in the stock and crypto markets.
It’s pretty minor from my perspective, but some people that have recently enjoyed 25% returns last year are freaking out! Some newer investors are getting their first real taste of dealing with their emotions when things aren’t going up. Welcome to investing.
The Tax Triangle
The US tax system is complicated with lots of rules, exceptions and nuance that can bite you. It’s important to understand the taxation of your investments on the way out because that directly impacts how much you need to have to be FI. I wouldn’t recommend trying to use the Wesley Snipes accounting method.
The tax triangle refers to three different groups of investment accounts that each receive their own tax treatment: tax free, taxable and tax deferred.
- Tax Free – No taxes due on the withdrawal of this money as long as the correct rules are followed. Examples: Roth Accounts, HSA’s used for qualified medical expenses.
- Taxable – Gets preferential long term capital gains (LTCG) tax treatment for qualified dividends and assets held longer than a year and a day. 0%, 15% and 20% LTCG taxation rates in 2022. Examples: Brokerage accounts, crypto brokerage account.
- Tax Deferred – Was saved pre-tax on the way in. Taxed as ordinary income when withdrawn from the account at your marginal tax bracket. Examples: t401k, tIRA, 403b, 457b, TSP, etc.
I introduce this idea briefly right now because that’s how you’re going to see my investible assets bucketed.
How I Track Progress
There are two main tools that I use to track our financial progress right now: personal capital and a spreadsheet.
Personal Capital (PC) does a good job of connecting to each of my accounts, aggregating that data and keeping it current. As account security has gotten tighter it does get a little more annoying as every month or two I need to resubmit credentials. You’ll see a few areas where I didn’t do that for a while and the charts look flat.
However, I also like to be able to see where that money is stored according to the tax triangle to help me see the amount in each area and what that breakdown in percentage wise. That information helps me understand if I need to make a change as to where to direct future investment dollars.
2021 Investment Account Values
Without further ado, here are the details! I’m going to use January 1st 2021 to January 15th 2022 as the period of review here because I took a snapshot of the accounts on January 15th. There are also a couple of bugs in the personal capital data so the chart dollar amounts don’t quite line up with my spreadsheet data but the spreadsheet data is right.
Summary Data
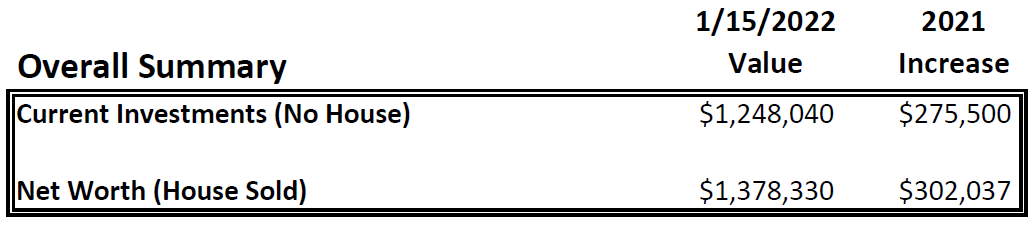
I think it’s easier to start with the high level summary and then dive into the details from there.
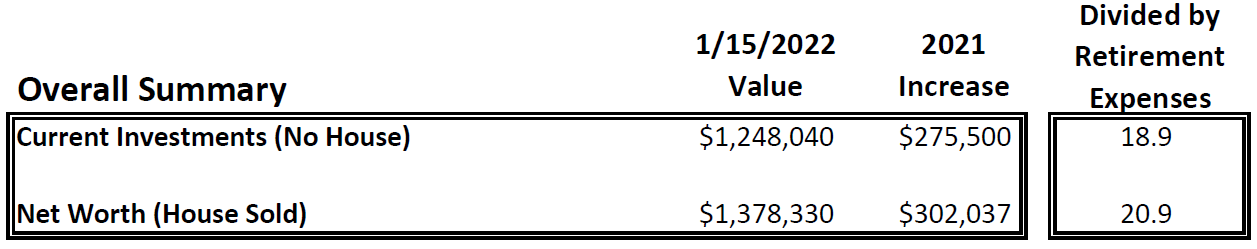
Current Investments (no house) is all of our investment accounts and cash but excludes our home equity. Net worth I’ll explain later in the article.
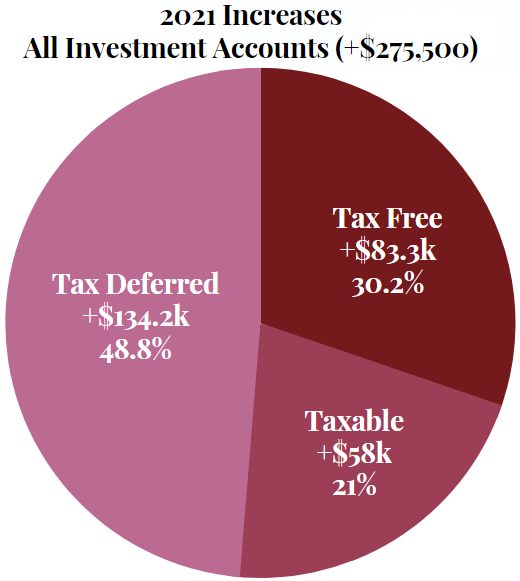
Breaking this down to the tax triangle, here is the distribution of those investment by tax treatment.
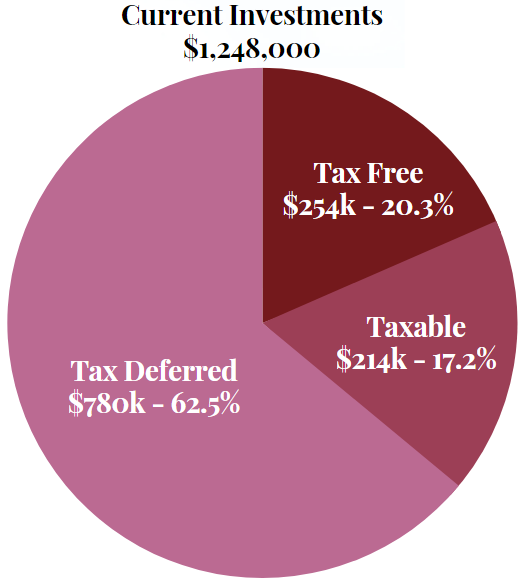
We have a situation that’s not uncommon – we’re heavy in tax deferred accounts. I’m still comfortable with contributing to a t401k because we’ve got a plan to draw down or Roth convert a good portion of that money when our income is much lower.
Some CFPs refer to this as the tax planning window between retirement starting and social security (SS) payments starting. Our tax planning window will likely be between ages 55 and 67. Income from jobs will have stopped and social security won’t have started so we’ll be in the lowest tax brackets.
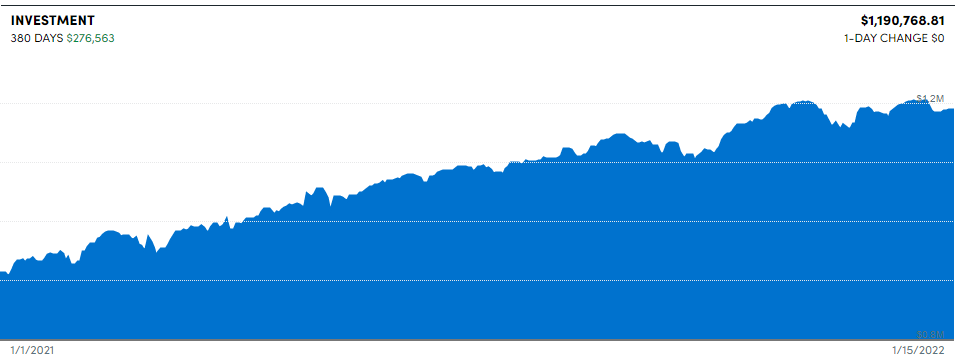
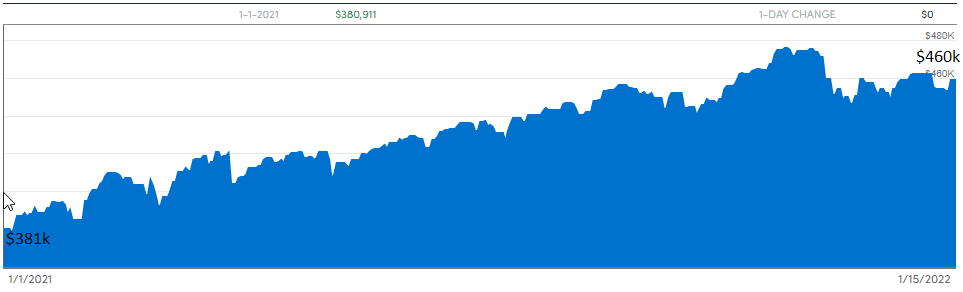
Total Investments and Cash Accounts (+$275,500)
A strong saving year plus a strong market year where the S&P500 gained 26.9% contributed to great gains overall. The +$275,500 is the total change in account balance. In other words, it includes both contributions and investment gains.
There’s a $15k mistake here because one of Mrs. MFI’s accounts wasn’t synching right and the value that personal capital charts see is “frozen” in time. So, the PC amount below should be +$261k for the year in investments, but then add in the cash accounts and we’re in the $281k range. I’ve rounded numbers all over the place for simplicity so the numbers don’t perfectly add up.
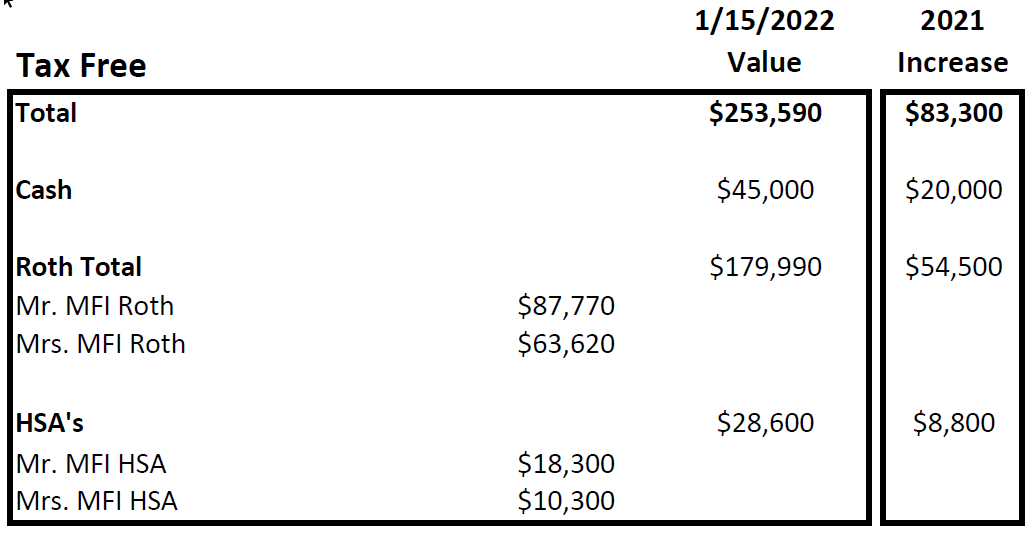
Tax Free Accounts (+$83,300)
Cash, our Roth accounts and our HSA accounts make up our “tax free” accounts. Savings account interest is taxed as ordinary income but the amount being made here is trivial so I put it here.
Including HSAs in this bucket might seem a little unsual. HSAs could actually be put into a couple of different places. As I covered in this post, the money coming out of an HSA is tax free when used for qualified medical expenses. Right now I’m planning to use it for that purpose including long term care.
After 59.5 years old you can withdraw from an HSA for non-medical expenses and it will be taxed as ordinary income. If I wanted to plan on that outcome we could stick it in the tax deferred bucket to plan for ordinary taxation on that money.
Cash (+$20,000)
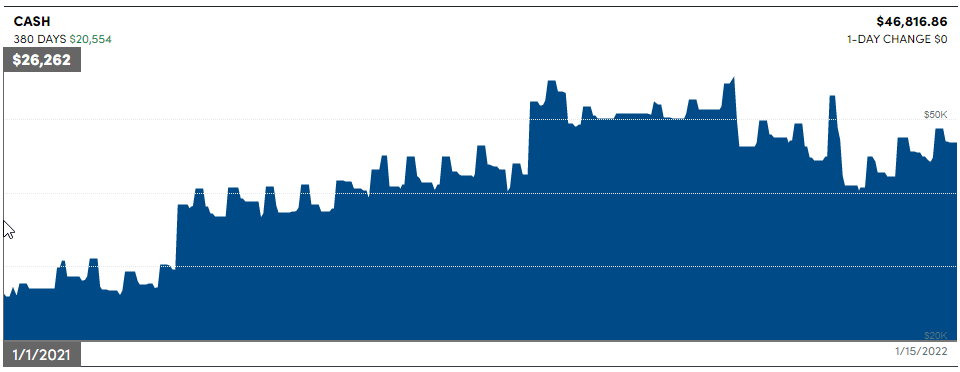
Cash listed here is cash held in non-investment accounts so it’s not part of the $1.19M listed above.
Why so much cash? Well, there are three high level sub-buckets:
- $10k – Old vacation funds – My employer changed vacation systems from an accrued system to “unlimited.” I have $10k stuck there until I separate from service.
- $10k – Checking/Sinking funds – I have a number of sinking funds in my YNAB managed budget. They’ll get spent eventually.
- $25k – Mrs. MFI savings – She feels good about having a decent amount in her savings account. We’ll get some of that invested soon but her feeling good is more important here than the financially optimum approach.
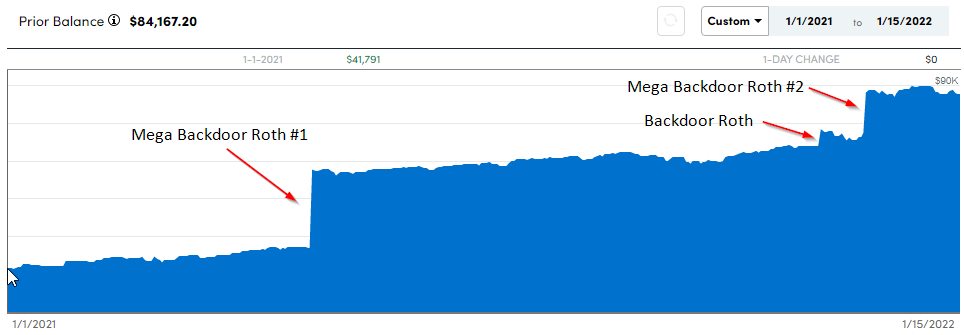
Roth Accounts (+$54,500)
We only started contributing to Roth accounts 6 or so years ago so we’re playing catch up here. I’m very fortunate to have a mega backdoor Roth (MBR) capability using my work 401k and have used that to maximize what the IRS will let me put into a Roth account. I’ll keep doing that as long as I have the income and the politicians don’t kill that option.
My work 401k makes the MBR a little tricky so I only plan to do one transfer a year. MBR #1 below is the transfer of funds accumulated in both late 2020 and early 2021. MBR #2 was because I was worried about the Build Back Better Act killing the backdoor so I proactively did a second transfer just to be safe.
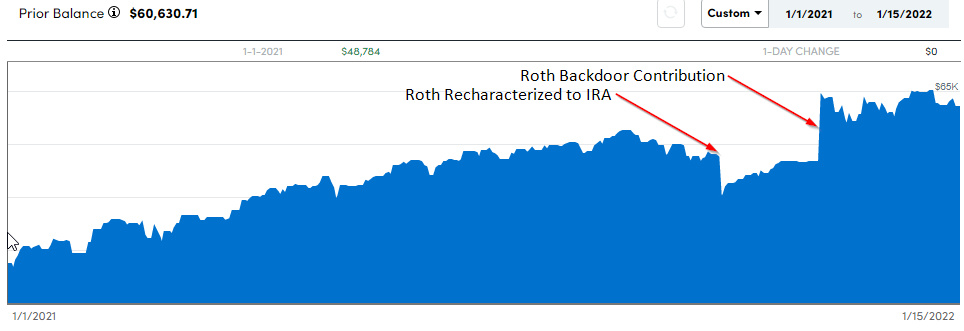
Due to some poor planning by me, we were potentially going to run into an issue of making too much money to contribute to a Roth the traditional way. As such, I backed out Roth contributions by re-charactizing them to an IRA and then backdoored them back into Roth a month later.
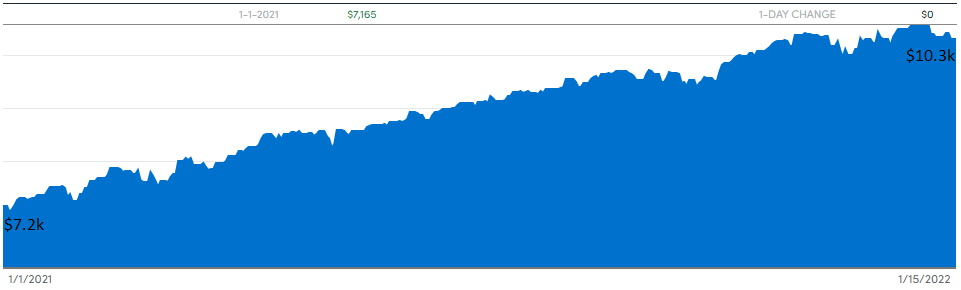
Health Savings Accounts (HSA) (+$8,800)
As I covered in this post, HSAs are awesome if you’re on a HDHP. Our accounts are quite new and small so they aren’t compounding much…yet. We continue to max them out and pay for medical expenses out of pocket so they should be north of $100k combined in about 7 years.
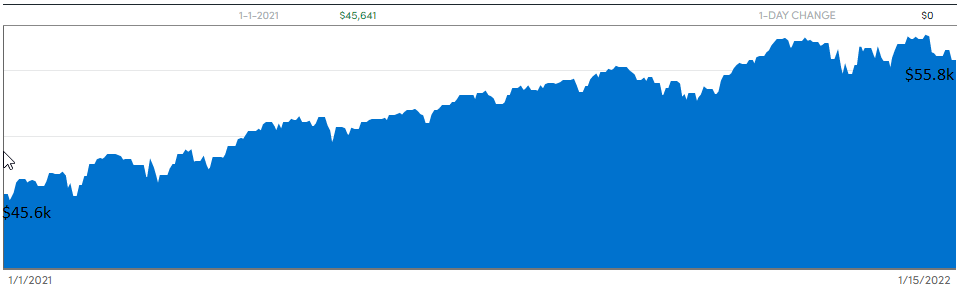
Taxable Accounts (+$58,000)
Our two taxable accounts are a traditional brokerage account mostly invested in stock index funds and a new crypto brokerage account.
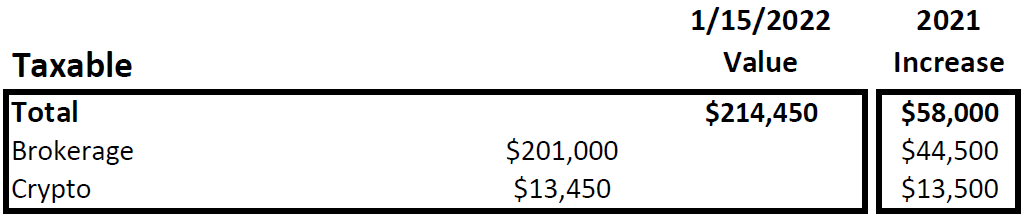
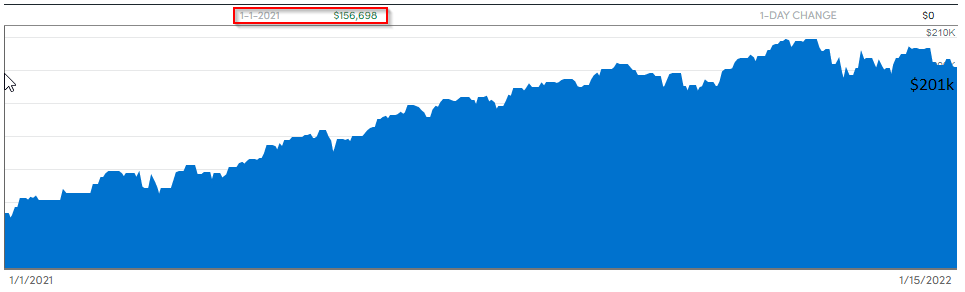
Brokerage (+$44,500)
The traditional brokerage contributions were lowered in priority as I was shoveling money into the crypto account when the prices started to fall near the end of year.
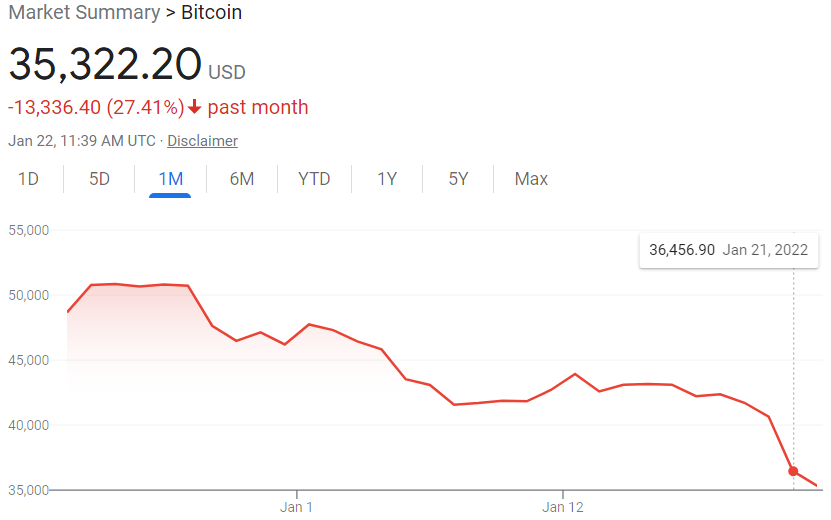
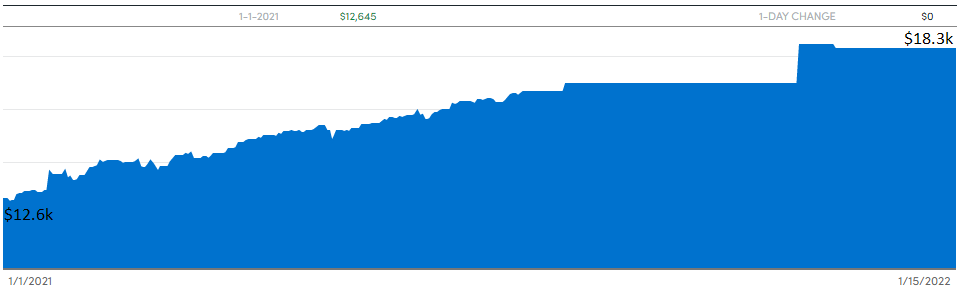
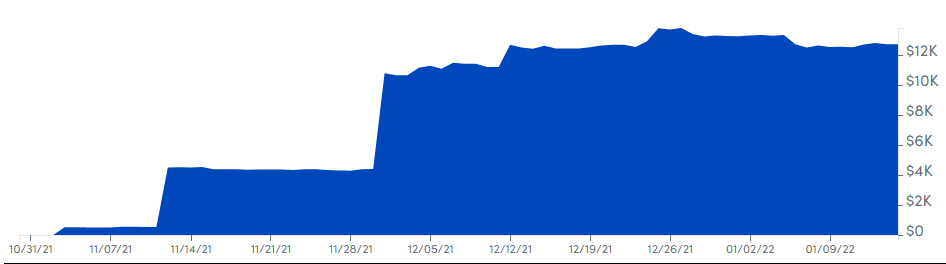
Crypto (+$13,500)
In late 2021 I decided that I had stayed out of the crypto space for long enough and started buying Bitcoin and Ether to diversify a bit into that space. I also moved some cash funds into stable coins to learn how they work and see how safe those 8% returns really are. I’m much more motivated to learn once I have some skin in the game.
Bitcoin peaked in price on November 8th so I timed that perfectly to “buy high”! The price has steadily dropped since then so I’ve been dollar cost averaging all the way down. Still waiting for the bottom! I have a small amount of crypto in another account besides what’s shown in this chart.
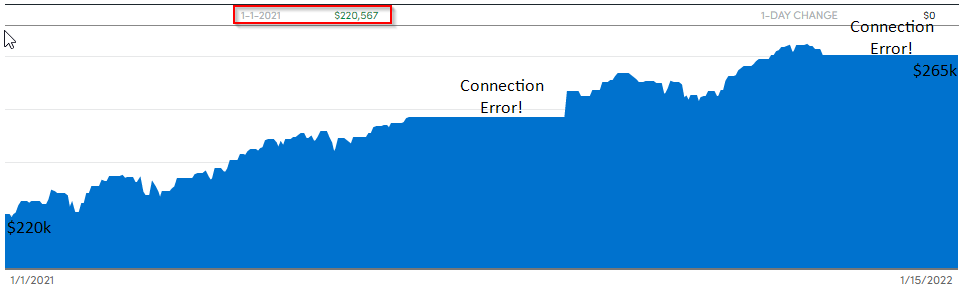
Tax Deferred Accounts (+$134,200)
Since these accounts are our oldest and largest it should come as no surprise that they saw the biggest jump in value. We put $50k into them courtesy of maxing them out plus employer matches and they saw another $84k in growth. That is some sweet compounding gains.
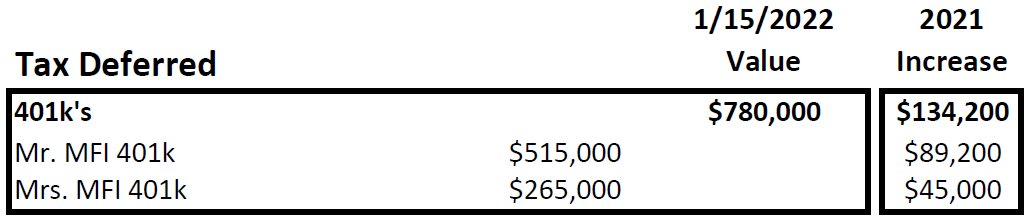
Mr. MFI 401k Accounts (+$89,200)
Mrs. MFI 401k Account (+$45,000)
Net Worth – Post House Sale
Net worth is a financial measure that takes into account all assets that you own minus liabilities. However, it doesn’t take into account the cost of liquidating fairly illiquid assets like houses. That’s a very real cost that you shouldn’t ignore.
In our case I wanted to account for those costs in a simple way so I’ve deducted 10% of the home value from the remaining equity number. This is 6% for realtor fees and another 4% for other expenses related to selling the house like repairs, moving and storage fees.
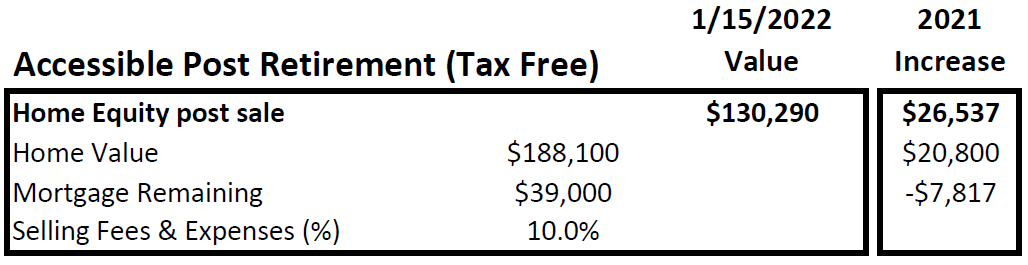
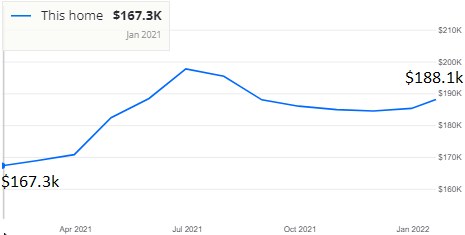
Our house went up in value like almost everyone else in 2021 and we paid down a good chunk of our small remaining mortgage. Since this is a primary residence and the capital gains are less than $500k it will be tax free for us as a married couple.
That $130k extra is what you see in the net worth (house sold) line. I haven’t included our paid off cars in our net worth. They’re only worth about $20-25k total and will keep depreciating.
Progress To Our FI Number
Those numbers are great, but where does that put us on our FI journey?
What Is Our FI Number?
Like the status of a dysfunctional relationship, the answer is complicated. All of these calculations involve taking an educated guess at your future retirement expenses and then applying your desired safe withdrawal rate to that.
Changes to your plan for family, lifestyle, location, healthcare and a million other variables make this a constantly moving target. My advice? Don’t drive yourself crazy trying to get it in the ballpark until you’re a year or two from retiring. Below is my current snapshot but I know this plan will change.
Retirement Expenses
Our expenses from last year were $55k, but I need to know our retirement expenses. I’ve added $5k as a health insurance placeholder for now.

I’ve also added an average 10% tax expense since we’ll have to pay taxes on most of the money coming out of our accounts. Don’t forget that the 4% rule of thumb didn’t take into account taxes! That’s an important line item that you need to have in your plan.
A 10% effective tax rate should be a good educated guess since we currently have a 15% effective tax rate on our ~$250k combined income. Taxes will likely go up but on $60k in income we’ll likely have an effective tax rate of less than 10%.
For those reasons, I’m using $66k/yr as our projected retirement expenses right now.
Our FI Number(s)
The FI community likes to use the 4% rule of thumb as their measure of hitting FI. Many debate if a 4% safe withdrawal rate (SWR) is too conservative or aggressive.
Regardless of where you fall in that debate, the initial study was based on a 30 year retirement. I’m planning on a ~45 year retirement from 50 years old to 95 and you just can’t extend the timeframe 50% longer and assume that the same SWR will be successful. For those reasons we’ll shoot for a 3.33% SWR which is 30x your annual expenses.
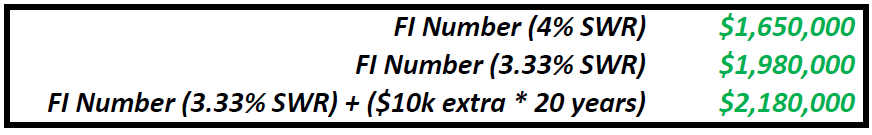
Another idea that I’m playing with is whether to add an additional bucket of fun money. An extra $200k (or some other number) that can be used to spend more in your early “go go” years when we’ll have more energy to have ridiculous adventures.
One thing to note is that this rough calculation assumes zero social security or other income in “retirement.” I need to refine this and see the impact of adding in some income.
Tracking to Our FI Number
With our $66k retirement expenses and a 3.33% SWR, how are we tracking to FI? We’re at $1,248,000 currently in relation to a $1,980,000 FI number which puts us 63% of the way to our FI number! That’s 18.9x our projected retirement expenses.
Thanks for reading! Where are you on your path to FI? How was your 2021? Drop a comment below.
Like the content? Click here to subscribe to the e-mail list and have the articles delivered to your inbox.